Virtual ML.Net: Introduction
Virtual ML.Net : Introduction

Last week, I had the privilege of speaking at an awesome event Virtual ML.Net. The event was totally virtual and organized and participated by ML.Net enthusiasts.
ML.Net is a cross-platform framework from Microsoft for developing Machine learning models in the .Net ecosystem. It allows .Net developers to solve business problems using machine learning algorithms leveraging their preferred language such as C#/F#. It’s highly scalable and used within Microsoft in many of its products such as Bing, Powerpoint, etc.
Key highlights of the event
- Awesome 2-day sessions covering breadth and depth of topics around ML.Net
- 1-day Hands-on Workshop with multiple labs
- Global Speakers covering 5 continents and 6 countries
- Mix of technical sessions, labs and case studies
- Sessions
- AI Ethics: Theory to adoption
- Machine learning simplified for developers with ML.Net
- Q & A with a Microsoft Data Scientist
- Transfer learning for Deep Learning: From Custom Vision to Tensorflow & ML.Net
- “You are what you eat”, or how to fight data with Jupyter Notebooks for .Net
- Decision Analysis with ML.Net and Blazor
- Even smarter chat bot with ML.Net
- COVID-19 Exploratory Data Analysis using .Net Dataframe API (C#)
- Building Serverless Machine learning API’s with Azure Functions, ML.Net and CosmosDB
Introduction
My presentation was on COVID-19 Exploratory Data Analysis using .Net Dataframe API (C#). It was divided into two parts as given below.
- Part-1: COVID-19 Data Analysis using .Net DataFrame API
- Part-2: COVID-19 Prediction using ML.Net framework
In this section, I’ll mainly cover few things covered as part of my presentation such as COVID-19, DataFrame API(EDA), ML.Net(Prediction). It’ll be a brief introduction to the topics, for working solution, please refer Part-1 and Part-2. Part-1 covers exploratory data analysis on COVID dataset for a particular day. Part-2 covers data analysis and prediction/forecasting for next 7 days using time-series COVID dataset. We’ll leverage recently introduced support for C# in Jupyter Notebook
Acknowledgement
- Dataset - Johns Hopkins CSSE
- COVID-19 data visualization using Python - Akshay Sb
- Organizers - Bri Achtman, Luis Quintanilla, Alexander Slotte and Jon Wood
- Sponsors - Excella and Wintellect
COVID-19
As per Wiki Coronavirus disease 2019 (COVID-19) is an infectious disease caused by severe acute respiratory syndrome coronavirus 2 (SARS-CoV-2). The disease was first identified in 2019 in Wuhan, the capital of China’s Hubei province, and has since spread globally, resulting in the ongoing 2019–20 coronavirus pandemic. The virus had caused a pandemic across the globe and spreading/affecting most of the nations.
Lets analyze some statistics
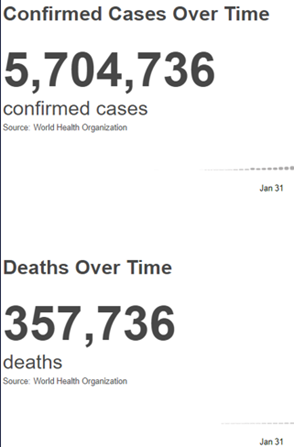
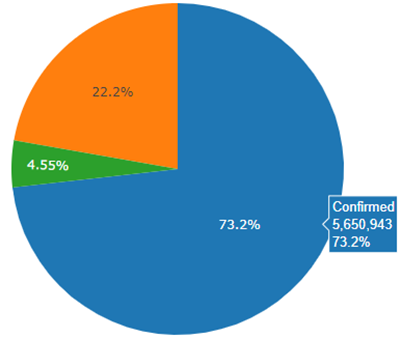
Number of confirmed cases and deaths as on May 28, 2020
Image source:https://covid19.who.int/
The above image just shows numbers for a particular date and seems to be a static data. It doesn’t give any information that could help in making some decisions to bring these numbers down. It would be good, if we can get historical data or a plot to understand the trend.
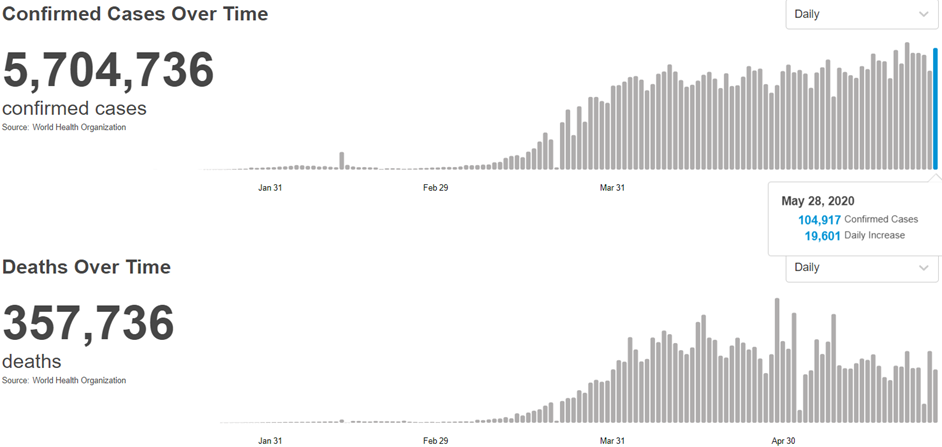
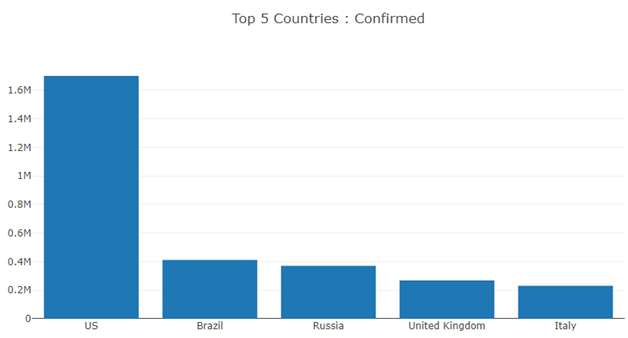
Plot for number of confirmed cases and deaths as on May 28, 2020
Image source:https://covid19.who.int/
The above plot is better compared to only numbers. Through this, we could see the trend of cases over a period of 5 months. The number of cases started in the last week of January and remained low till mid-march. However, there is huge increase in the number of cases post that and it continued to increase which is quite alarming.
Similarly, different plots as shown below gives information in a way that can be analyzed and interpreted for making better decisions and take precautionary actions.
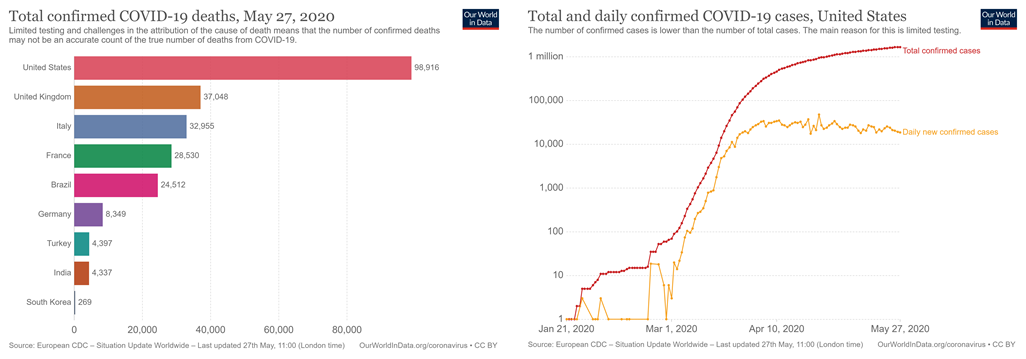
Image Source: https://slides.ourworldindata.org/2020_pandemic/2020_pandemic#/title-slide
Exploratory Data Analysis(EDA)
As per Wiki,
“In statistics, exploratory data analysis (EDA) is an approach to analyzing data sets to summarize their main characteristics, often with visual methods.
A statistical model can be used or not, but primarily EDA is for seeing what the data can tell us beyond the formal modeling or hypothesis testing task.”
Its mainly analysis of data which on its own doesn’t convey much about it and acts dumb. The analysis is presented in different form through various visualizations which include tables, plots such as bar, pie, scatter etc.

Let me give an analogy here. Consider you just moved to new place and looking to rent a house. In order to buy a house, you’ll look for attributes such as number of bedrooms, type(Apartment or villa), locality and crime rate. If someone provides this information in a static manner(specific date), you won’t be able to make a decision. You would be interested in history to make a decision. Even that information won’t help much, better if its presented in a visual way of table/plots. This will help in making decision quick and relevant.
We’ll be using .Net DataFrame API to perform EDA
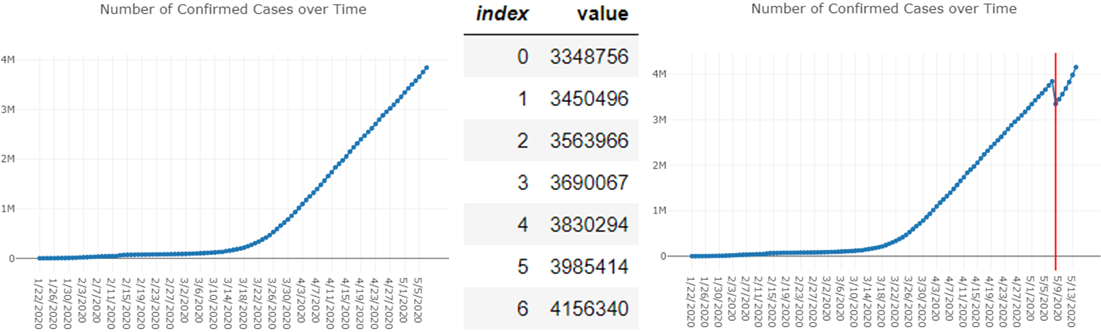
Time Series Analysis
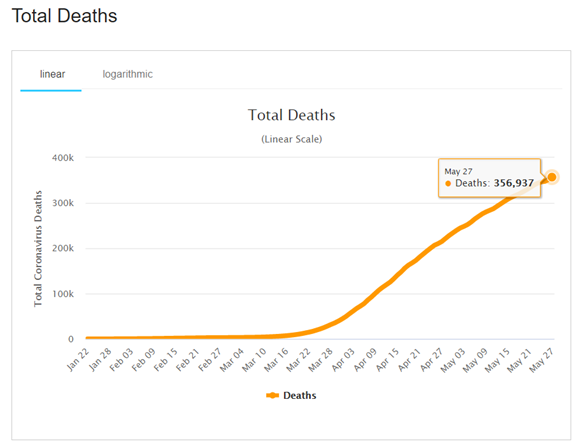
Number of deaths over time
Its the analysis of data organized across units of time. It helps understand past trends and plan for future. There are different types of time series analysis that can be performed such as Trends, Seasonality, Irregularity and Cyclic.
I have applied this to our COVID-19 dataset and plot a chart on the number of confirmed cases over time. I also did a prediction using ML.Net for the number of cases over next 7 days.
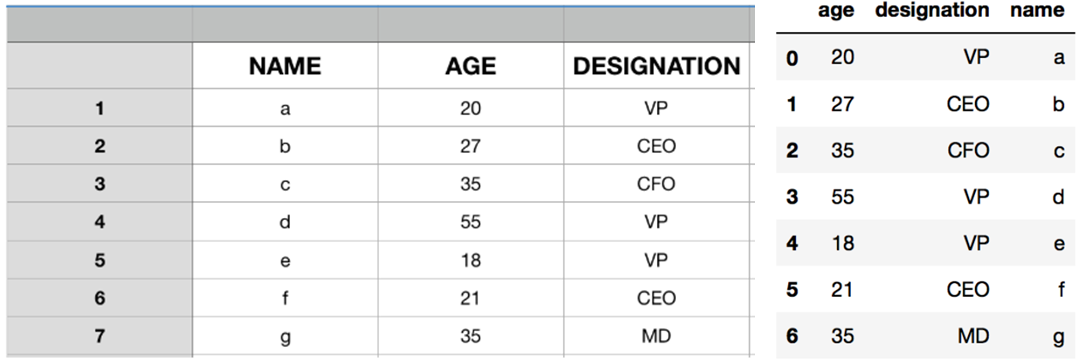
DataFrame
A DataFrame is a two-dimensional data structure holding information in a tabular way similar to spreadsheet. It has rows and columns, with columns having data of same type. It’s mainly used for statistical analysis on the dataset and a great tool for performing exploratory data analysis by data scientists. Its present in many languages such as Python and R. For e.g, on the left side in below image, the data is represented as in spreadsheet. The same is represented on right when its loaded by Python API. The API’s present in a language allows performing operations similar to spreadsheet such as filtering, grouping, sorting and many more.
.Net DataFrame
DataFrame has been a great tool of Data scientists for performing exploratory data analysis. There was nothing present in Microsoft ecosystem till December’19 when it was introduced for the first time in .Net ecosystem and allowed .Net developers to perform EDA. I have used to perform EDA on COVID-19 dataset and its present in Part-2. Some of the attributes of DataFrame are given as below
- A collection of Columns
- In-memory representation of structured data
- Similar to Python DataFrame
- Features
- Load dataset from Csv
- Row/Column Selection
- Join/Merge DataFrame
- GroupBy
- Handling Null values
While working on .Net DataFrame, I came across a similar datatype(IDataView) present in .Net ecosystem. They might look similar but have somewhat different purpose. The below table helps in differentiating them.
| DataFrame | IDataView |
|---|---|
| Part of Microsoft.Data Namespace | Part of Microsoft.ML Namespace |
| Analogous to List | Analogous to IList |
| Useful for .Net developers interested in Data Science(Exploration) | Useful for .Net developers interested in Machine Learning (Prediction) |
| Schemaless | Schema bound |
| Eagerly loaded | Lazy loaded |
| In-memory | Stream based with forward cursor only support |
| Allow random access | No random access |
| Easy to debug | Hard to debug |
| Supports only CSV | Supports CSV, IEnumerable, Relational DB |
| Follows Apache Arrow Format | Follows Schema |
ML.Net
I gave a little introduction on ML.Net in the beginning. In Part-2, it was mainly used for making prediction using time-series methodology(Single Spectrum Analysis). MLContext is used to load data and create an ML pipeline. TimeSeriesCatalog.ForecastBySsa API from ML.Net is used to predict the total number of confirmed cases in next 7 days.
Single Spectrum Analysis
SSA is a powerful framework for decomposing the time-series into trend, seasonality and noise components as well as forecasting the future values of the time-series. In principle, SSA performs spectral analysis on the input time-series where each component in the spectrum corresponds to a trend, seasonal or noise component in the time-series. For details of the Singular Spectrum Analysis (SSA), refer to this document.
Visualization
Visualization is an integral part of EDA. It allows multiple representation of data present in raw format. I have used table and plots (bar, pie, scatter) for visualization. Some of them is shown below
Confirmed Vs Deaths Vs Recovered
 </br>
</br>
Prediction : Before and After
Conclusion
In this post, I have just touched on the things covered as part of my presentation. Please move on to Part-1 and thereafter Part-2 for more detailed analysis and explanation. I would recommend to have a look at other presentation of Virtual ML.Net conference and I am sure you would love them as I did. This was the first edition of Virtual ML.Net and I wish to have many more of these. I am running a telegram ML.Net group for ML.Net enthusiasts, please feel free to join it. I wish a bigger and bolder next edition of Virtual ML.Net.
Source Code: https://github.com/praveenraghuvanshi1512/covid-19
If you liked it, please like/comment at Comments. It’ll encourage me to write more.
Links
- Resources
- Contact
- LinkedIn : https://in.linkedin.com/in/praveenraghuvanshi
- Github : https://github.com/praveenraghuvanshi1512
- Twitter : @praveenraghuvan
Made with :heart: by ML.Net enthusiast