Virtual ML.Net: Part-2 COVID-19 Time Series Analysis and Prediction using ML.Net framework
Part - 2: COVID-19 Time Series Analysis and Prediction using ML.Net framework
COVID-19
- As per Wiki Coronavirus disease 2019 (COVID-19) is an infectious disease caused by severe acute respiratory syndrome coronavirus 2 (SARS-CoV-2). The disease was first identified in 2019 in Wuhan, the capital of China’s Hubei province, and has since spread globally, resulting in the ongoing 2019–20 coronavirus pandemic.
- The virus had caused a pandemic across the globe and spreading/affecting most of the nations.
- The purpose of notebook is to visualize the number of confirmed cases over time and predicting it for next 7 days using time series in ML.Net
Acknowledgement
- Johns Hopkins CSSE for dataset
- COVID-19 data visualization by Akshay Sb
Dataset
Introduction
This is Part-2 of our analysis on the COVID-19 dataset provided by Johns Hopkins CSSE. In Part-1, I did data analysis on the dataset and created some tables and plots for getting insights from it. In Part-2, I’ll focus on applying machine learning for making a prediction using time-series API’s provided by ML.Net framework. I’ll be building a model from scratch on the number of confirmed cases and predicting for the next 7 days. Later on, I’ll plot these numbers for better visualization.
ML.Net is a cross-platform framework from Microsoft for developing Machine learning models in the .Net ecosystem. It allows .Net developers to solve business problems using machine learning algorithms leveraging their preferred language such as C#/F#. It’s highly scalable and used within Microsoft in many of its products such as Bing, PowerPoint, etc.
Disclaimer: This is an exercise to explore different features present in ML.Net. The actual and predicted numbers might vary due to several factors such as size and features in a dataset.
Summary
Below is the summary of steps we’ll be performing
- Define application level items
- Nuget packages
- Namespaces
- Constants
- Utility Functions
- Formatters
- Dataset and Transformations
- Actual from Johns Hopkins CSSE
- Transformed time_series_covid19_confirmed_global_transposed.csv
- Data Classes
- ConfirmedData : Provides a map between columns in a dataset
- ConfirmedForecast : Holds predicted values
- Data Analysis
- Visualize Data using DataFrame API
- Display Top 10 Rows - dataframe.Head(10)
- Display Last 10 Rows - dataframe.Tail(10)
- Display Dataset Statistics - dataframe.Description()
- Plot of TotalConfimed cases vs Date
- Load Data - MLContext
- ML Pipeline
- Train Model
- Prediction/Forecasting
- Prediction Visualization
- Prediction Analysis
- Conclusion
Note : Graphs/Plots may not render in GitHub due to security reasons, however if you run this notebook locally/binder they will render.
#!about
 </img> </img> | .NET Interactive © 2020 Microsoft Corporation Version: 1.0.130302+84eb63d57e6b46e2e6be496a3555923d6f459802 Build date: 2020-06-03T19:01:42.3234746Z |
1. Define Application wide Items
Nuget Packages
// ML.NET Nuget packages installation
#r "nuget:Microsoft.ML"
#r "nuget:Microsoft.ML.TimeSeries"
#r "nuget:Microsoft.Data.Analysis"

// Install XPlot package
#r "nuget:XPlot.Plotly"
Installed package Microsoft.ML version 1.5.0
Installed package Microsoft.Data.Analysis version 0.4.0
Installed package Microsoft.ML.TimeSeries version 1.5.0
Installed package XPlot.Plotly version 3.0.1
Namespaces
using System;
using System.Collections.Generic;
using System.Linq;
using Microsoft.ML;
using Microsoft.ML.Data;
using Microsoft.Data.Analysis;
using Microsoft.ML.Transforms.TimeSeries;
using Microsoft.AspNetCore.Html;
using XPlot.Plotly;
Constants
const string CONFIRMED_DATASET_FILE = "time_series_covid19_confirmed_global_transposed.csv";

// Forecast API
const int WINDOW_SIZE = 5;
const int SERIES_LENGTH = 10;
const int TRAIN_SIZE = 100;
const int HORIZON = 7;

// Dataset
const int DEFAULT_ROW_COUNT = 10;
const string TOTAL_CONFIRMED_COLUMN = "TotalConfirmed";
const string DATE_COLUMN = "Date";
2. Utility Functions
Formatters
By default the output of DataFrame is not proper and in order to display it as a table, we need to have a custom formatter implemented as shown in next cell.
Formatter<DataFrame>.Register((df, writer) =>
{
    var headers = new List<IHtmlContent>();
    headers.Add(th(i("index")));
    headers.AddRange(df.Columns.Select(c => (IHtmlContent) th(c.Name)));
    var rows = new List<List<IHtmlContent>>();
    var take = DEFAULT_ROW_COUNT;
    for (var i = 0; i < Math.Min(take, df.Rows.Count); i++)
    {
        var cells = new List<IHtmlContent>();
        cells.Add(td(i));
        foreach (var obj in df.Rows[i])
        {
            cells.Add(td(obj));
        }
        rows.Add(cells);
    }

    var t = table(
        thead(
            headers),
        tbody(
            rows.Select(
                r => tr(r))));

    writer.Write(t);
}, "text/html");
3. Dataset and Transformations
Download Dataset
- Actual Dataset: Johns Hopkins CSSE
- Transformed Dataset: time_series_covid19_confirmed_global_transposed.csv
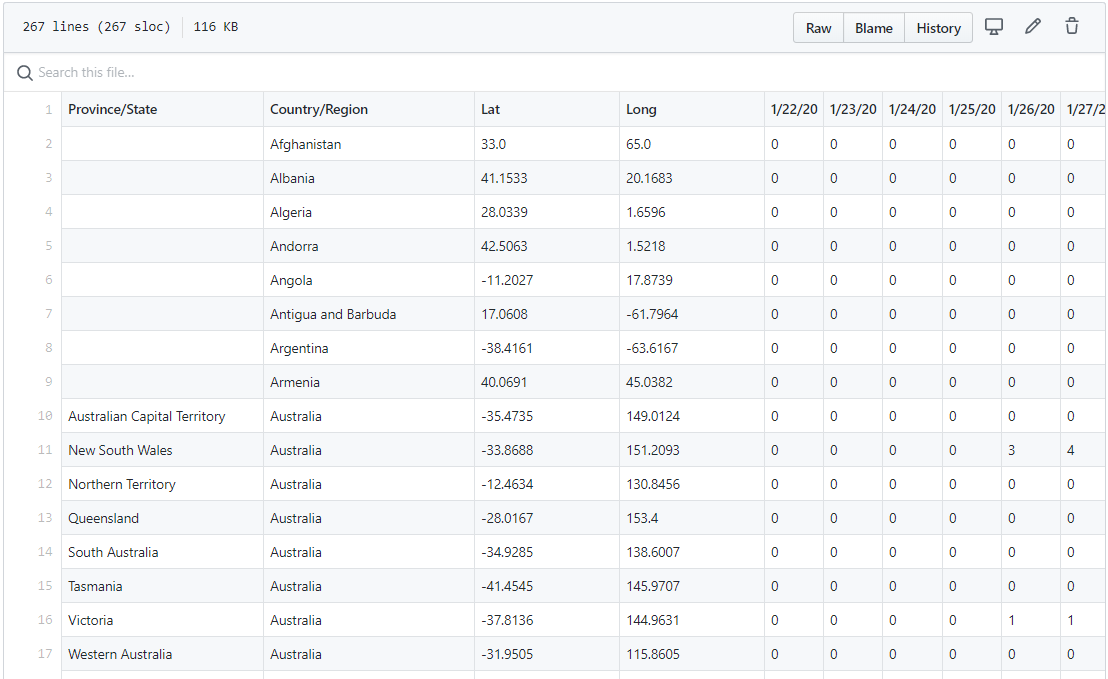
I’ll be using COVID-19 time series dataset from Johns Hopkins CSSE and will be performing predictions using time_series_covid19_confirmed_global.csv file.
The data present in these files have name of the countries as Rows and dates as columns which makes it difficult to map to our classes while loading data from csv. Also, it contains data per country wise. In order to keep things simple I’ll work with global count of COVID-19 cases and not specific country.
I have done few transformations to the dataset as below and created transformed csv’s
- Sum cases from all the countries for a specific date
- Just have two rows with Date and Total
- Applied transformation to the csv for converting Rows into Columns and vice-versa. Refer for transformation.
- Below transposed files have been saved in the current GitHub directory. There is no change in dataset. The files have data till 05-27-2020
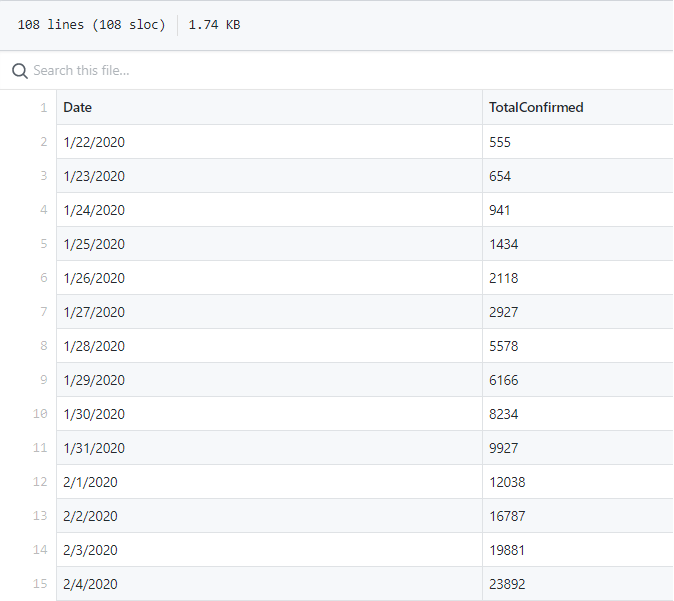
- time_series_covid19_confirmed_global_transposed.csv : Columns - Date, TotalConfirmed
Before transformation
After transformation
4. Data Classes
Now, we need to create few data structures to map to columns within our dataset.
Confirmed cases
/// <summary>
/// Represent data for confirmed cases with a mapping to columns in a dataset
/// </summary>
public class ConfirmedData
{
    /// <summary>
    /// Date of confirmed case
    /// </summary>
    [LoadColumn(0)]
    public DateTime Date;

    /// <summary>
    /// Total no of confirmed cases on a particular date
    /// </summary>
    [LoadColumn(1)]
    public float TotalConfirmed;
}
/// <summary>
/// Prediction/Forecast for Confirmed cases
/// </summary>
internal class ConfirmedForecast
{
    /// <summary>
    /// No of predicted confirmed cases for multiple days
    /// </summary>
    public float[] Forecast { get; set; }
}
5. Data Analysis
For loading data from csv, first we need to create MLContext that acts as a starting point for creating a machine learning model in ML.Net. Few things to note
- Set hasHeader as true as our dataset has header
- Add separatorChar to ‘,’ as its a csv
Visualize Data - DataFrame
var predictedDf = DataFrame.LoadCsv(CONFIRMED_DATASET_FILE);
predictedDf.Head(DEFAULT_ROW_COUNT)
| index | Date | TotalConfirmed |
|---|---|---|
| 0 | 1/22/2020 | 555 |
| 1 | 1/23/2020 | 654 |
| 2 | 1/24/2020 | 941 |
| 3 | 1/25/2020 | 1434 |
| 4 | 1/26/2020 | 2118 |
| 5 | 1/27/2020 | 2927 |
| 6 | 1/28/2020 | 5578 |
| 7 | 1/29/2020 | 6166 |
| 8 | 1/30/2020 | 8234 |
| 9 | 1/31/2020 | 9927 |
predictedDf.Tail(DEFAULT_ROW_COUNT)
| index | Date | TotalConfirmed |
|---|---|---|
| 0 | 4/28/2020 | 3097229 |
| 1 | 4/29/2020 | 3172287 |
| 2 | 4/30/2020 | 3256910 |
| 3 | 5/1/2020 | 3343777 |
| 4 | 5/2/2020 | 3427584 |
| 5 | 5/3/2020 | 3506729 |
| 6 | 5/4/2020 | 3583055 |
| 7 | 5/5/2020 | 3662691 |
| 8 | 5/6/2020 | 3755341 |
| 9 | 5/7/2020 | 3845718 |
predictedDf.Description()
| index | Description | TotalConfirmed |
|---|---|---|
| 0 | Length (excluding null values) | 107 |
| 1 | Max | 3845718 |
| 2 | Min | 555 |
| 3 | Mean | 923109.56 |
Number of Confirmed cases over Time
// Number of confirmed cases over time
var totalConfirmedDateColumn = predictedDf.Columns[DATE_COLUMN];
var totalConfirmedColumn = predictedDf.Columns[TOTAL_CONFIRMED_COLUMN];

var dates = new List<string>();
var totalConfirmedCases = new List<string>();
for (int index = 0; index < totalConfirmedDateColumn.Length; index++)
{
    dates.Add(totalConfirmedDateColumn[index].ToString());
    totalConfirmedCases.Add(totalConfirmedColumn[index].ToString());
}
var title = "Number of Confirmed Cases over Time";
var confirmedTimeGraph = new Graph.Scattergl()
    {
        x = dates.ToArray(),
        y = totalConfirmedCases.ToArray(),
        mode = "lines+markers"
    };


var chart = Chart.Plot(confirmedTimeGraph);
chart.WithTitle(title);
display(chart);
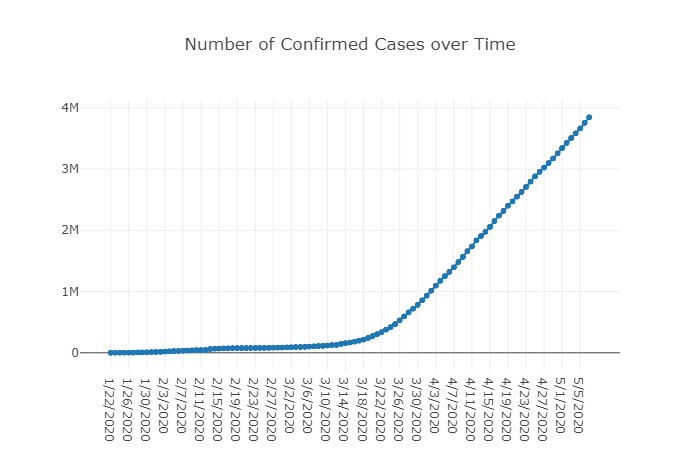
Analysis
- Duration: 1/22/2020 through 5/27/2020
- Total records: 127
- Case on first day: 555
- Case on last day: 5691790
- No of confirmed cases was low in the beginning, there was first jump around 2/12/2020 and an exponential jump around 3/22/2020.
- Cases have been increasing at an alarming rate in the past two months.
6. Load Data - MLContext
var context = new MLContext();
var data = context.Data.LoadFromTextFile<ConfirmedData>(CONFIRMED_DATASET_FILE, hasHeader: true, separatorChar: ',');
7. ML Pipeline
For creating ML Pipeline for a time-series analysis, we’ll use Single Spectrum Analysis. ML.Net provides built in API for same, more details could be found at TimeSeriesCatalog.ForecastBySsa
var pipeline = context.Forecasting.ForecastBySsa(
                nameof(ConfirmedForecast.Forecast),
                nameof(ConfirmedData.TotalConfirmed),
                WINDOW_SIZE,
                SERIES_LENGTH,
                TRAIN_SIZE,
                HORIZON);
8. Train Model
We are ready with our pipeline and ready to train the model
var model = pipeline.Fit(data);
9. Prediction/Forecasting - 7 days
Our model is trained and we need to do prediction for next 7(Horizon) days. Time-series provides its own engine for making prediction which is similar to PredictionEngine present in ML.Net. Predicted values show an increasing trend which is in alignment with recent past values.
var forecastingEngine = model.CreateTimeSeriesEngine<ConfirmedData, ConfirmedForecast>(context);
var forecasts = forecastingEngine.Predict();
display(forecasts.Forecast.Select(x => (int) x))
| index | value |
|---|---|
| 0 | 3348756 |
| 1 | 3450496 |
| 2 | 3563966 |
| 3 | 3690067 |
| 4 | 3830294 |
| 5 | 3985414 |
| 6 | 4156340 |
10. Prediction Visualization
var lastDate = DateTime.Parse(dates.LastOrDefault());
var predictionStartDate = lastDate.AddDays(1);

for (int index = 0; index < HORIZON; index++)
{
    dates.Add(lastDate.AddDays(index + 1).ToShortDateString());
    totalConfirmedCases.Add(forecasts.Forecast[index].ToString());
}
var title = "Number of Confirmed Cases over Time";
var layout = new Layout.Layout();
layout.shapes = new List<Graph.Shape>
{
    new Graph.Shape
    {
        x0 = predictionStartDate.ToShortDateString(),
        x1 = predictionStartDate.ToShortDateString(),
        y0 = "0",
        y1 = "1",
        xref = 'x',
        yref = "paper",
        line = new Graph.Line() {color = "red", width = 2}
    }
};

var chart1 = Chart.Plot(
new []
    {
        new Graph.Scattergl()
        {
            x = dates.ToArray(),
            y = totalConfirmedCases.ToArray(),
            mode = "lines+markers"
        }
    },
    layout
);

chart1.WithTitle(title);
display(chart1);
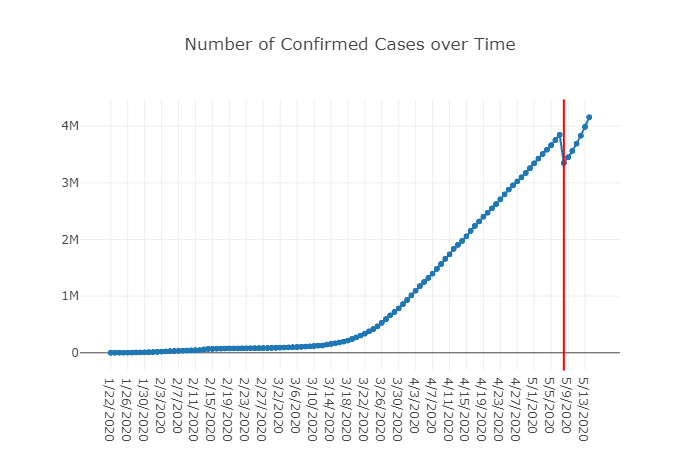
11. Analysis
Comparing the plots before and after prediction, it seems our ML model has performed reasonably well. The red line represents the data on future date(5/8/2020). Beyond this, we predicted for 7 days. Looking at the plot, there is a sudden drop on 5/8/2020 which could be accounted due to insufficient data as we have only 127 records. However we see an increasing trend for next 7 days in alignment with previous confirmed cases. We can extend this model for predicting confirmed cases for any number of days by changing HORIZON constant value. This plot is helpful in analyzing the increased number of cases and allow authorities to take precautionary measures to keep the numbers low.
Conclusion
I hope you have enjoyed reading the notebook, and might have got some idea on the powerful framework ML.Net. ML.Net is a very fast emerging framework for .Net developers which abstracts lot of complexity present in the field of Data science and Machine Learning. The focus of Part-2 notebook is leverage ML.Net for making predictions using time-series API. The model generated can be saved as a zip file and used in different applications.
Source Code: https://github.com/praveenraghuvanshi1512/covid-19
If you liked it, please like/comment at Comments. It’ll encourage me to write more.
Contact
LinkedIn : https://in.linkedin.com/in/praveenraghuvanshi
Github : https://github.com/praveenraghuvanshi1512
Twitter : @praveenraghuvan
References
- Tutorial: Forecast bike rental service demand with time series analysis and ML.NET
- Time Series Forecasting in ML.NET and Azure ML notebooks by Gopal Vashishtha